What this article covers
- Analysable time is a clinical figure, not a technical one. At 90% on a 21-day study you have lost about 50 hours of recording, and you were not told which 50.
- The loss is not evenly spread. Contact degrades during movement, and movement is when symptomatic episodes happen, so the bias runs against detection.
- Screening amplifies the problem. A camp applies hundreds of monitors in one day and discovers the failures three weeks later, by which time the patients have gone home.
A patient hands back the monitor after three weeks. The report arrives, the rhythm summary reads sinus with occasional ectopy, and somewhere near the top of the first page there is a percentage describing how much of the recording the system could interpret. Most readers skip it.
That percentage is the confidence interval on everything below it. A study reported at 88% analysable is a study where roughly one day in eight is missing, and nothing in the summary tells you which day.
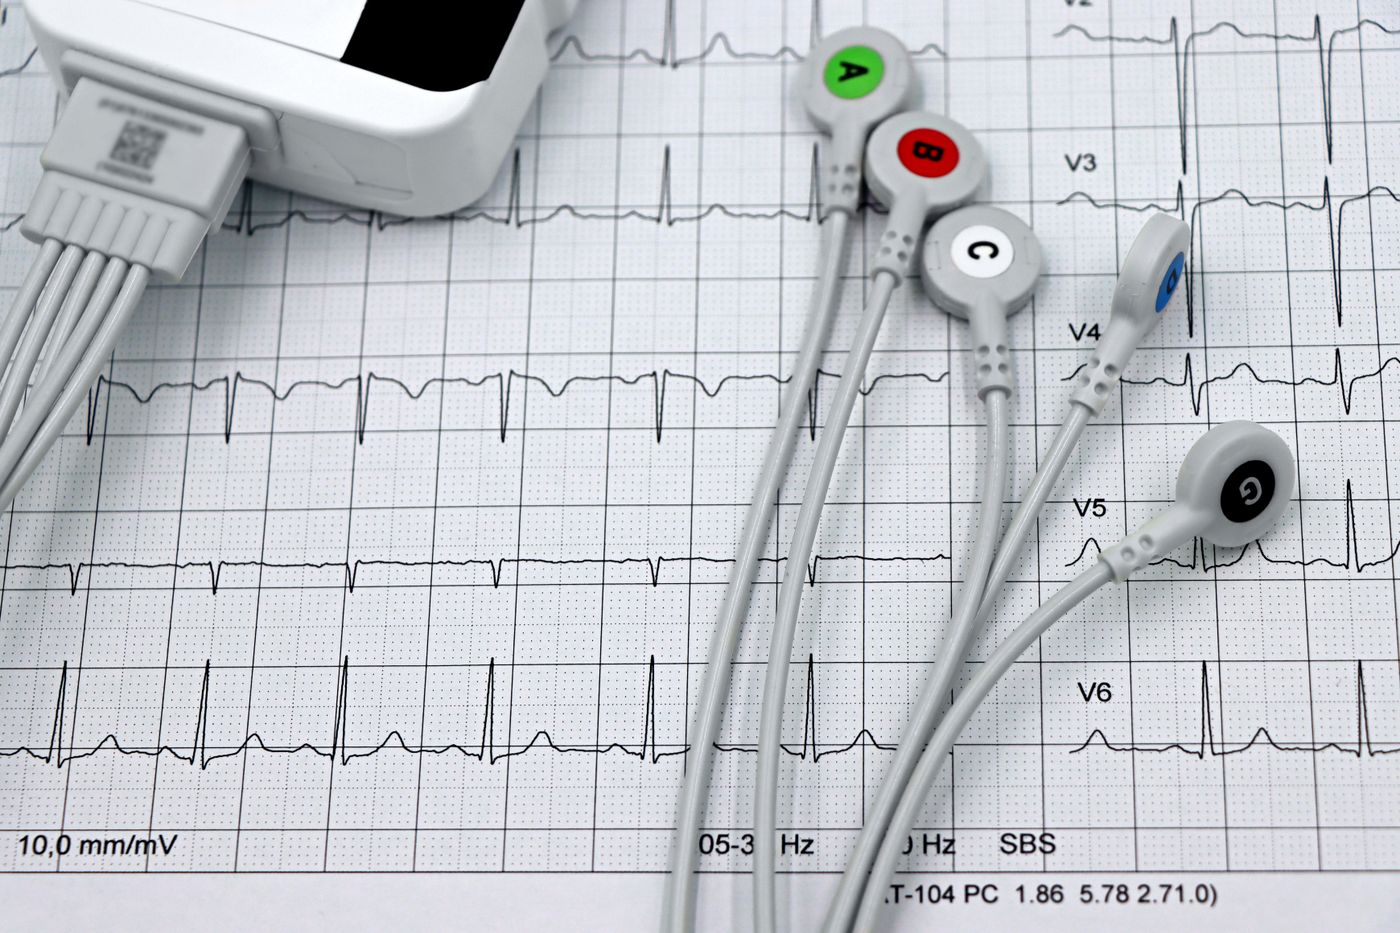
The figure at the top of the report
Analysable time is the proportion of the wear period the system could interpret, after discarding stretches where the trace was too corrupted to classify. It is the single most useful number on an ambulatory report and the one least often quoted when devices are compared.
The benchmark is public. Across 26,751 consecutive patients wearing an extended adhesive patch, Turakhia and colleagues reported a median analysable time of 99% of total wear.1 That figure has been available since 2013, which makes it a reasonable thing to hold a supplier to rather than an aspiration.
| Reported analysable time | Recording lost | Equivalent |
|---|---|---|
| 99% | 5 hours | Comparable to the published benchmark |
| 95% | 25 hours | A full day of the study is absent |
| 90% | 50 hours | Two days absent, distribution unknown |
| 85% | 76 hours | Three days absent, and the summary reads the same |
Swipe the table sideways to see all columns.
Ask for this figure per patient rather than as a fleet average. A supplier quoting a mean across thousands of studies is telling you about the median patient, and the patient in front of you may be the one whose electrode lifted on day three.
The missing hours are the wrong hours
If the lost hours were scattered at random, losing 10% of a recording would cost roughly 10% of the yield and you could reason about it. They are not scattered at random.
Contact between the electrode and the skin degrades most during movement, sweating and showering. Symptomatic arrhythmia also tends to occur during exertion and during the ordinary activity that produces sweat. The hours a monitor is most likely to discard overlap with the hours you most wanted recorded.
This is why a normal extended study still needs qualification when analysable time is low. A clean summary drawn from 85% of a recording is a weaker negative than the same summary drawn from 99%, and the patient hears the same sentence either way.
What fails over three weeks
A monitor worn for 24 hours and a monitor worn for 21 days are different problems, and the difference is entirely about the interface with the patient.
The conductive gel dries. Skin sheds and regenerates underneath the adhesive. Sweat changes the chemistry of the contact and then evaporates. A corner of the adhesive lifts after a shower and never fully reseats. Each of these raises the electrical resistance between the patient and the recorder, and the noise the recorder has to work against rises with it.
None of this is visible to the patient, who reports that they wore the device as instructed and did nothing wrong. They usually did nothing wrong. Late-wear signal quality is a property of the device and the application, and it is the thing bench testing on a fresh electrode at day one will not tell you.
What this looks like in a screening camp
In a department, a failed study is an annoyance. The patient is on a list, someone notices, and a repeat gets arranged. In a screening programme the same failure behaves differently.
A camp applies monitors to a large number of people in a single day, often with staff trained that morning, on patients who travelled to reach the site and will not travel again. The recording quality is discovered when the devices come back, which is two or three weeks after the camp has closed and the team has moved to the next block. There is no repeat. Every study that comes back thin is a person screened on paper and not screened in fact.
Three practical consequences follow for anyone planning that kind of deployment. Skin preparation at application is the highest-leverage thing a camp can control, and it is the step most often shortened when a queue builds. Written patient instructions in the local language change late-wear quality more than any device specification. And a programme should require per-study quality reporting in the contract, because a supplier who reports only rhythm findings has no incentive to tell you the recording was thin.
Six questions before you deploy a monitor
These are the questions we would ask a supplier if we were buying rather than building, and we expect to answer them ourselves when a department evaluates our own device.
- What is the median analysable time, and across how many studies? A figure without a denominator is a marketing claim.
- How does analysable time behave by day of wear? A single number for the whole study hides a curve that falls.
- Is the quality figure reported per patient on the report itself? If it is not on the page the clinician reads, it is not doing its job.
- What happens to the raw recording? The full trace should be retained and retrievable, so a disputed classification can be re-read rather than argued about.
- What is the false-alarm rate per 24 hours, in absolute counts? Percentage accuracy over millions of beats is not a number a reader experiences.
- What is the intended use, and what regulatory status supports it? A screening or wellness clearance and a diagnostic indication are different things, and the difference matters when a normal result is read as reassurance.4
What the automated report can tell you
Automated classification earns its place by sorting three weeks of trace into something a reader can work through in the time available. It does not earn a verdict.
The specific failure worth knowing about is that movement artefact and ventricular tachycardia can look similar on a single lead. Both are high in amplitude, irregular and broad. A classifier that has not been exposed to the artefact a particular device produces will not report uncertainty when it sees it. It will report ventricular tachycardia with high confidence, and it will do so at the moment the patient was climbing stairs.
The consequence is asymmetric. A missed supraventricular run costs a finding. A confident false alert costs the reader's trust in the automated layer, and once that is gone the department reads every study by hand, which removes the reason for buying the device. This is why every classification we produce travels with the strip that generated it, a timestamp and a confidence value, and why the interpretation stays with the clinician who signs the report.
The honest position on any of this is that recording duration and recording quality are separate claims. A device that records for three weeks and analyses 85% of it has given you seventeen usable days. Ask which number you are being sold.